
Live demo
A model that fails its own checks, on purpose
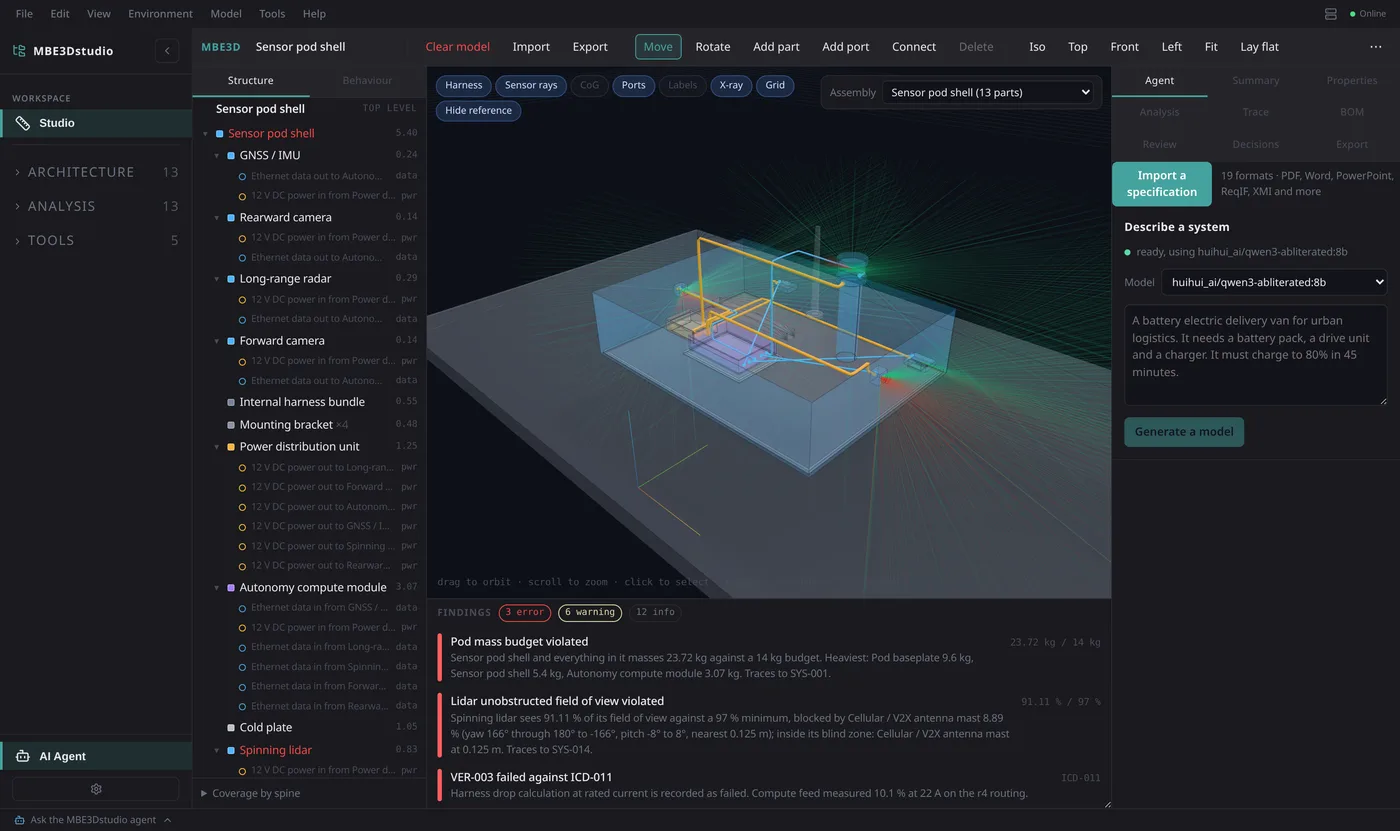
MBE3Dstudio opens on a roof-mounted autonomy sensor pod that does not pass all of its own checks, because a tool that opens on an all-green model teaches you nothing about what it is for.
Needs a modern browser with WebGL. The optional agent calls a server.
The demo is the real software, not a recording: it generates against a few example specifications, a handful of runs a day. Credits let you generate from your own specification and export CAD.
What the model found
Each one names a part and a requirement
Nobody wrote these into the demo as text. They are what the analysis pass returns when it runs on the model, and they change the moment you move a part.
-
Lidar field of view violated
The spinning lidar cannot see all of the field it declares, and the thing in the way is named for you: the cellular / V2X antenna mast, mounted where it shadows the sensor.
Two parts that are individually fine, mounted where they shadow each other. SYS-014
-
VER-003 failed against ICD-011
The recorded harness drop verification is marked failed. It describes a routing that a later revision replaced, while the live check on the routing that is actually in the model passes.
The record and the geometry are the same artefact, so the studio can show you that they have drifted apart instead of leaving you to find out. ICD-011
-
Pod mass budget violated
The pod and everything mounted in it is over the mass the vehicle programme allocated, and the heaviest parts are ranked, so you know where to start.
This requirement was closed for three revisions. Weighing the geometry reopened it. SYS-001
That last one passed for a long time, and the pass was not real. The shell and the baseplate each stated a mass their own feature trees do not contain. A check that compares every stated mass against the volume its geometry sweeps found both, the stated figures were corrected to what the parts are actually made of, and a requirement that had been closed for revisions opened again. The demo got worse and the model got true, which is the whole argument for keeping geometry and budgets in one artefact.
Warnings sit underneath the errors: a compute module and a power distribution unit mounted close enough to heat each other, the function “Maintain the V2X link” that no component has been given, a requirement that nothing verifies and nothing carries, and a pair of bounds written as bare numbers, which do not say what they measure.
Trace
Coverage you did not have to maintain
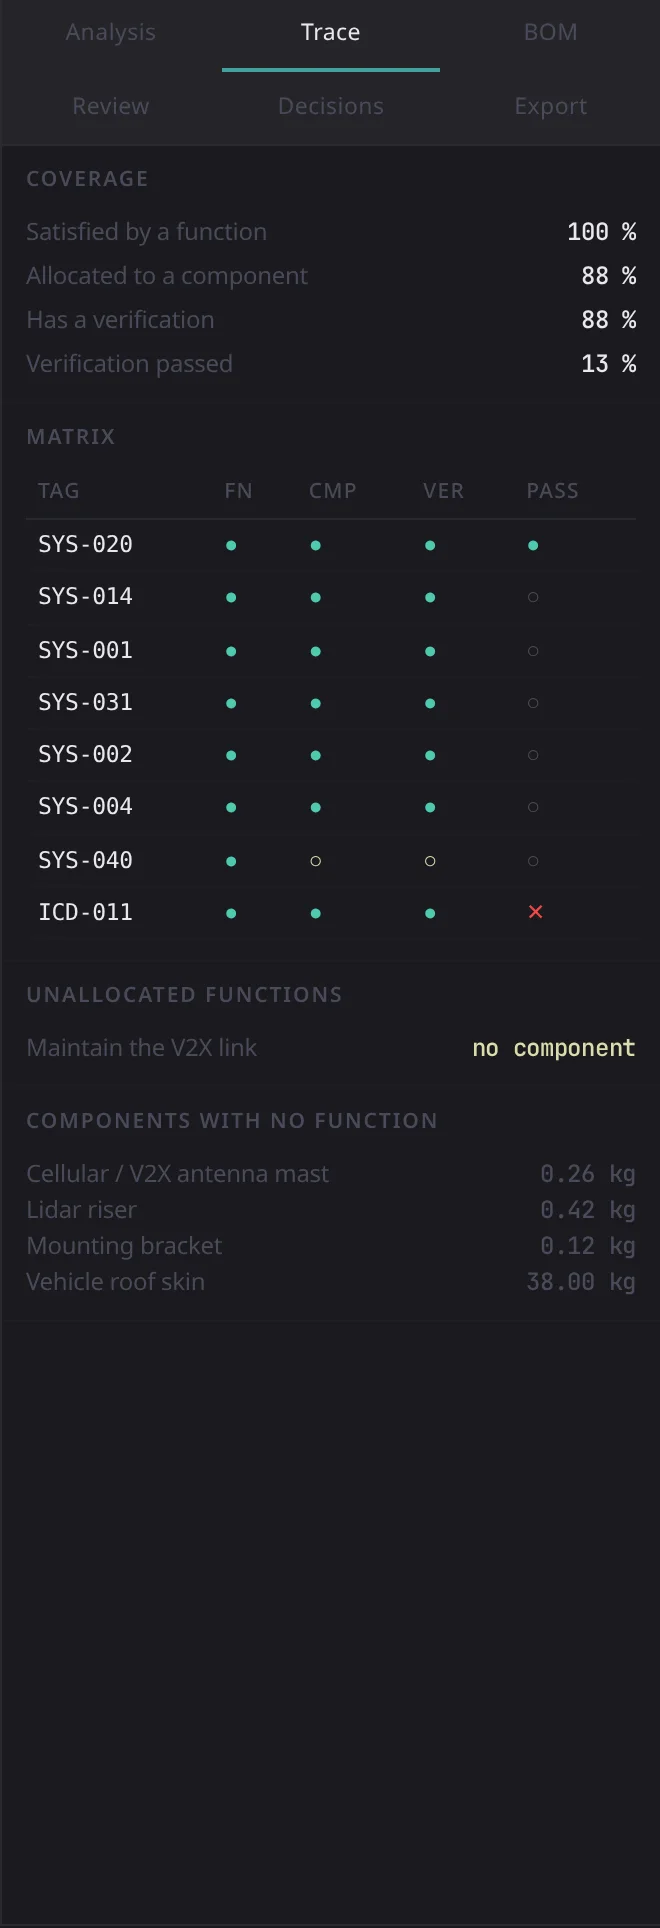
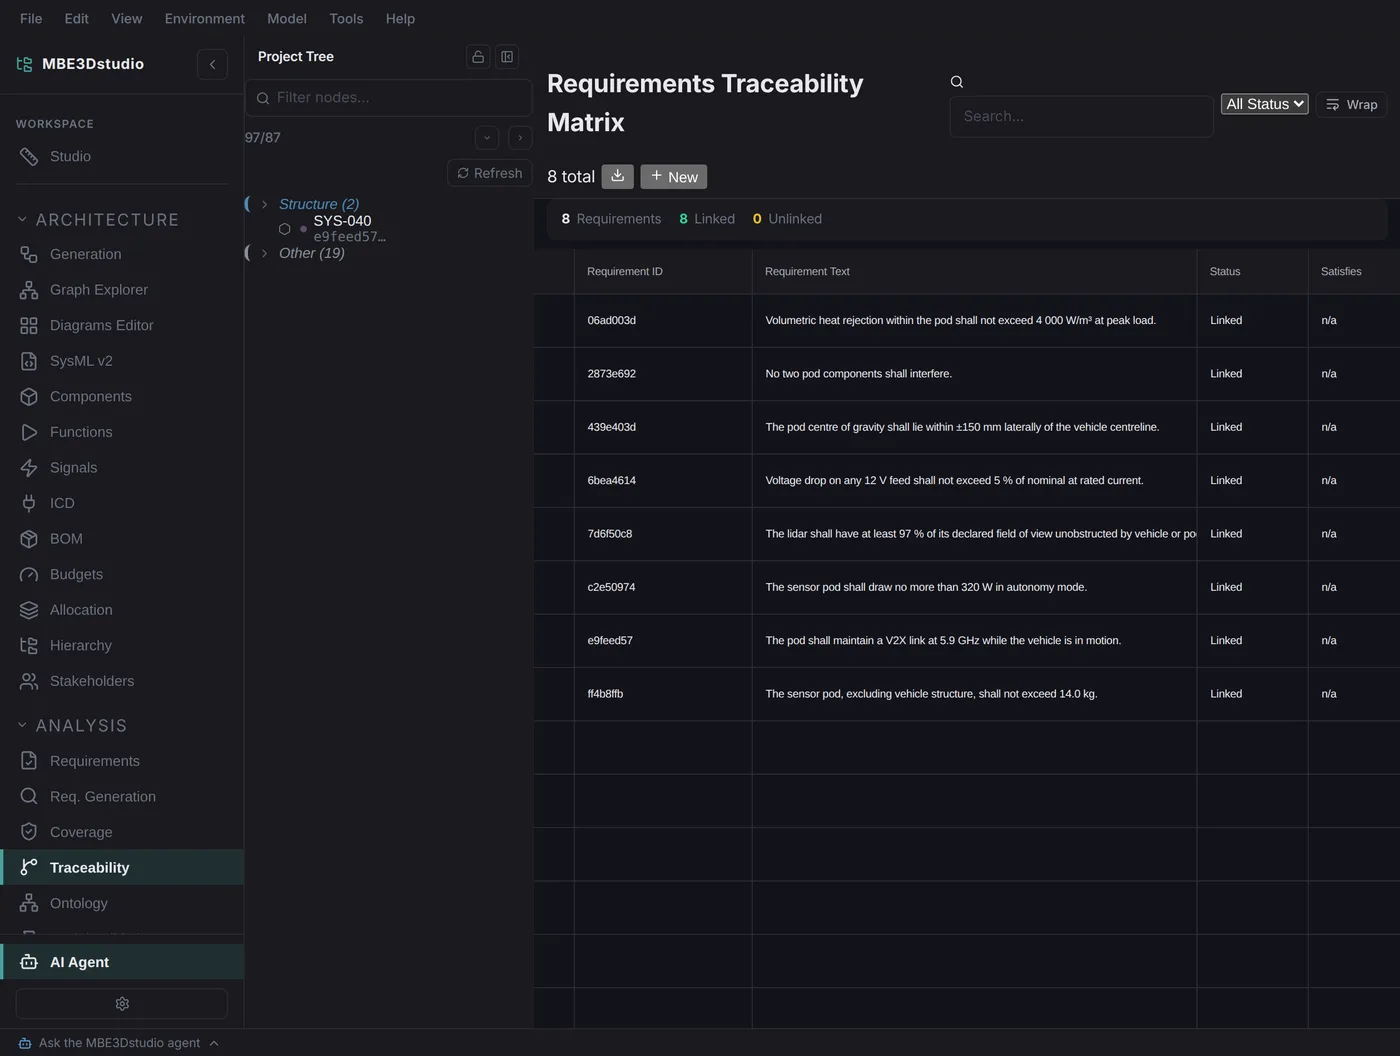
Every counted requirement is satisfied by a function. Most are allocated to a component and have a verification activity. Far fewer have actually passed one, and that is the column worth looking at, because it is the one a hand-maintained matrix is worst at keeping honest.
The matrix is derived from the graph on every render. There is no stored trace document, so there is nothing that can drift.
Analysis
Every rolled-up number, in one place
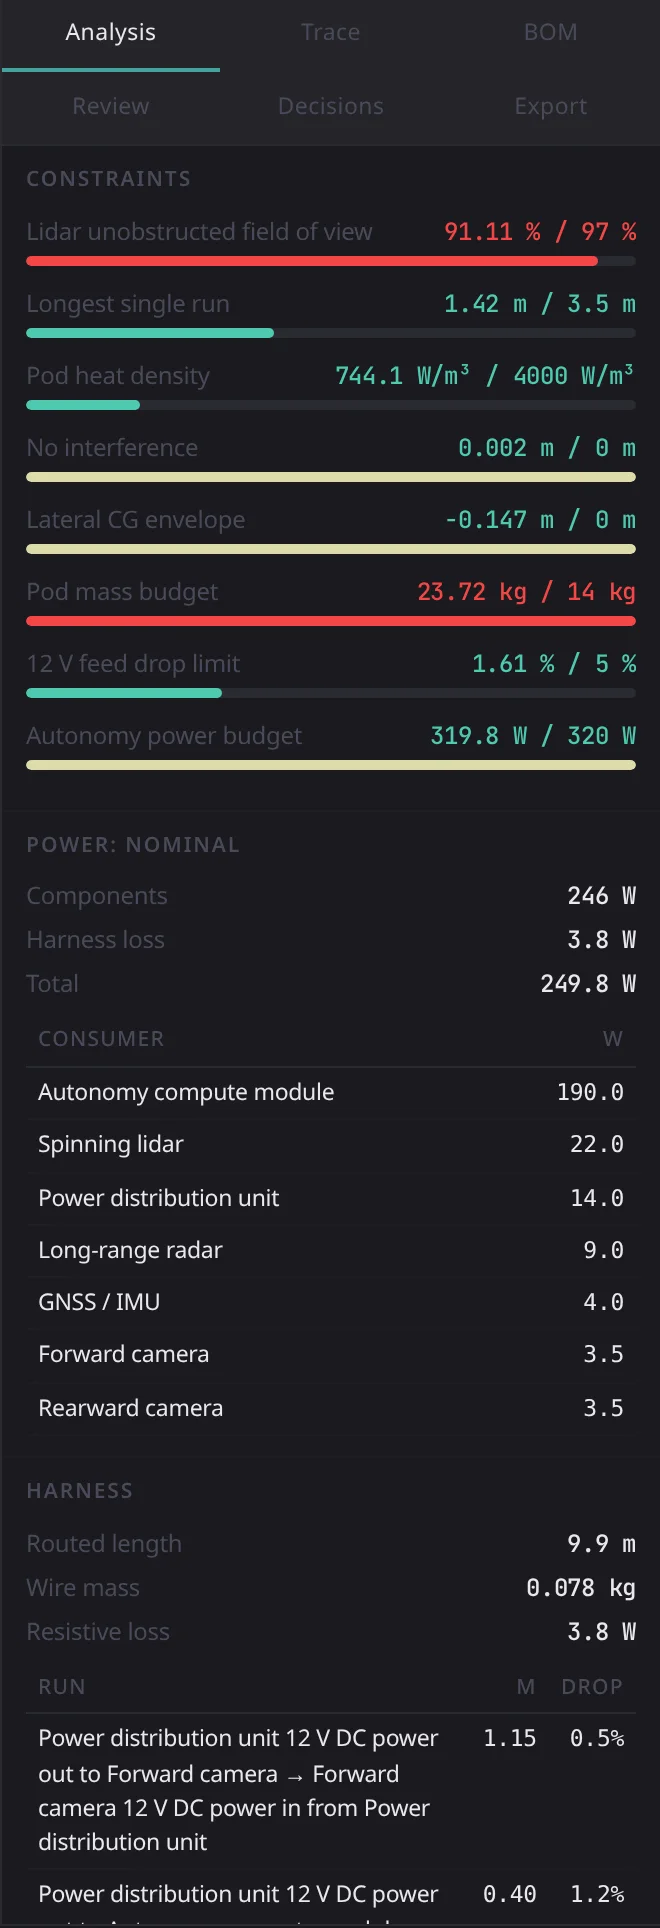
Mass properties with the full inertia tensor. Power for each operating mode, with the largest consumers ranked. Every harness run with its gauge, length, current, drop and dissipated watts. Sensor coverage with the principal occluder named for each.
Change a mass in the inspector and every one of these updates before you have finished typing. Then undo, and they come back.
BOM
The bill of materials is the same model
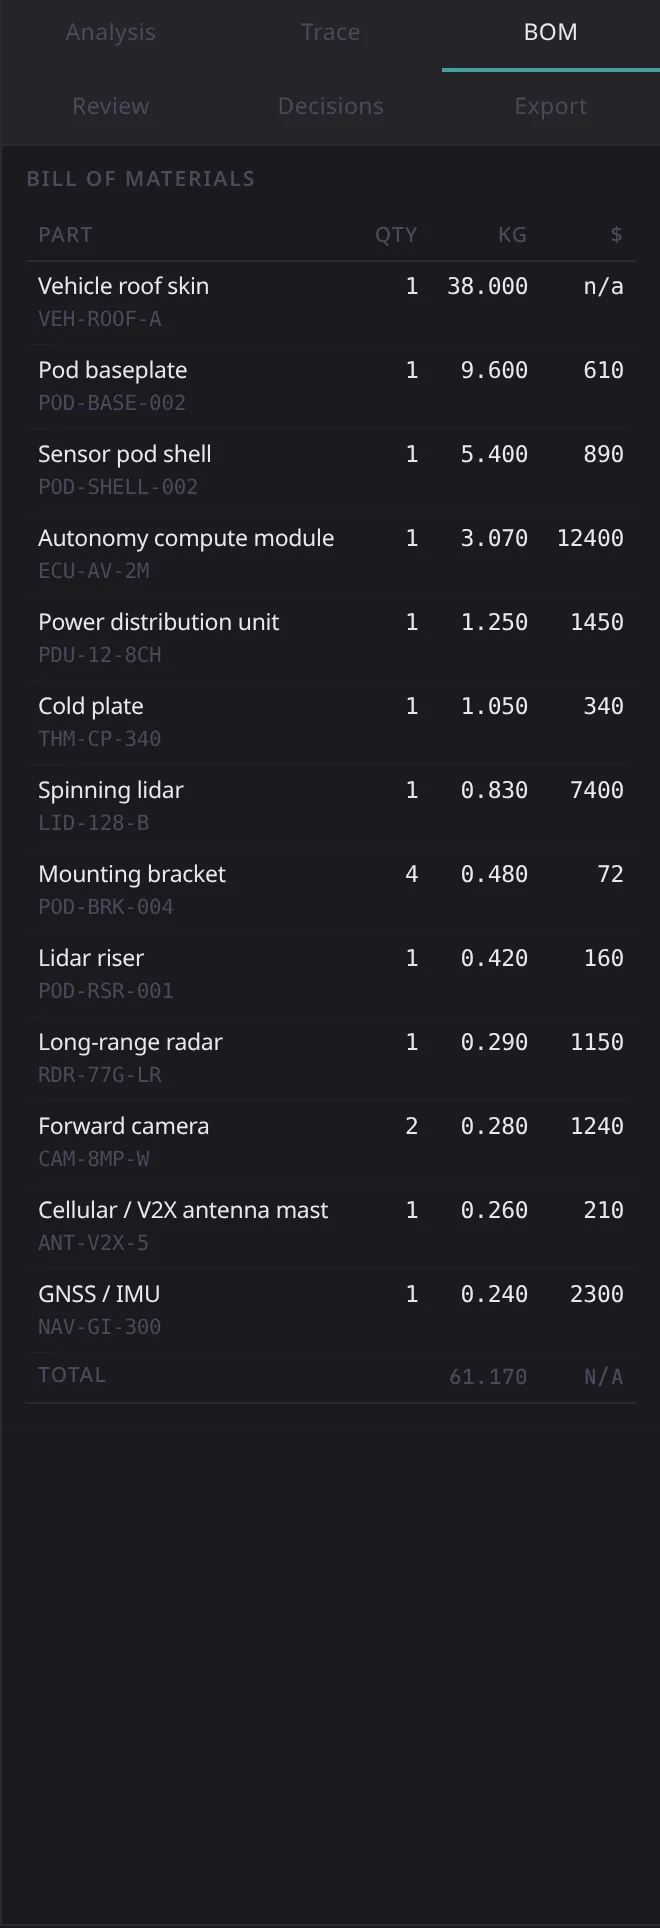
Part numbers, suppliers, quantities, unit and extended cost, rolled up from the same assembly tree that produced the mass number. Export it as CSV and it agrees with the review document, because both came out of one pass.
The rest of the studio
The viewport is one view of many
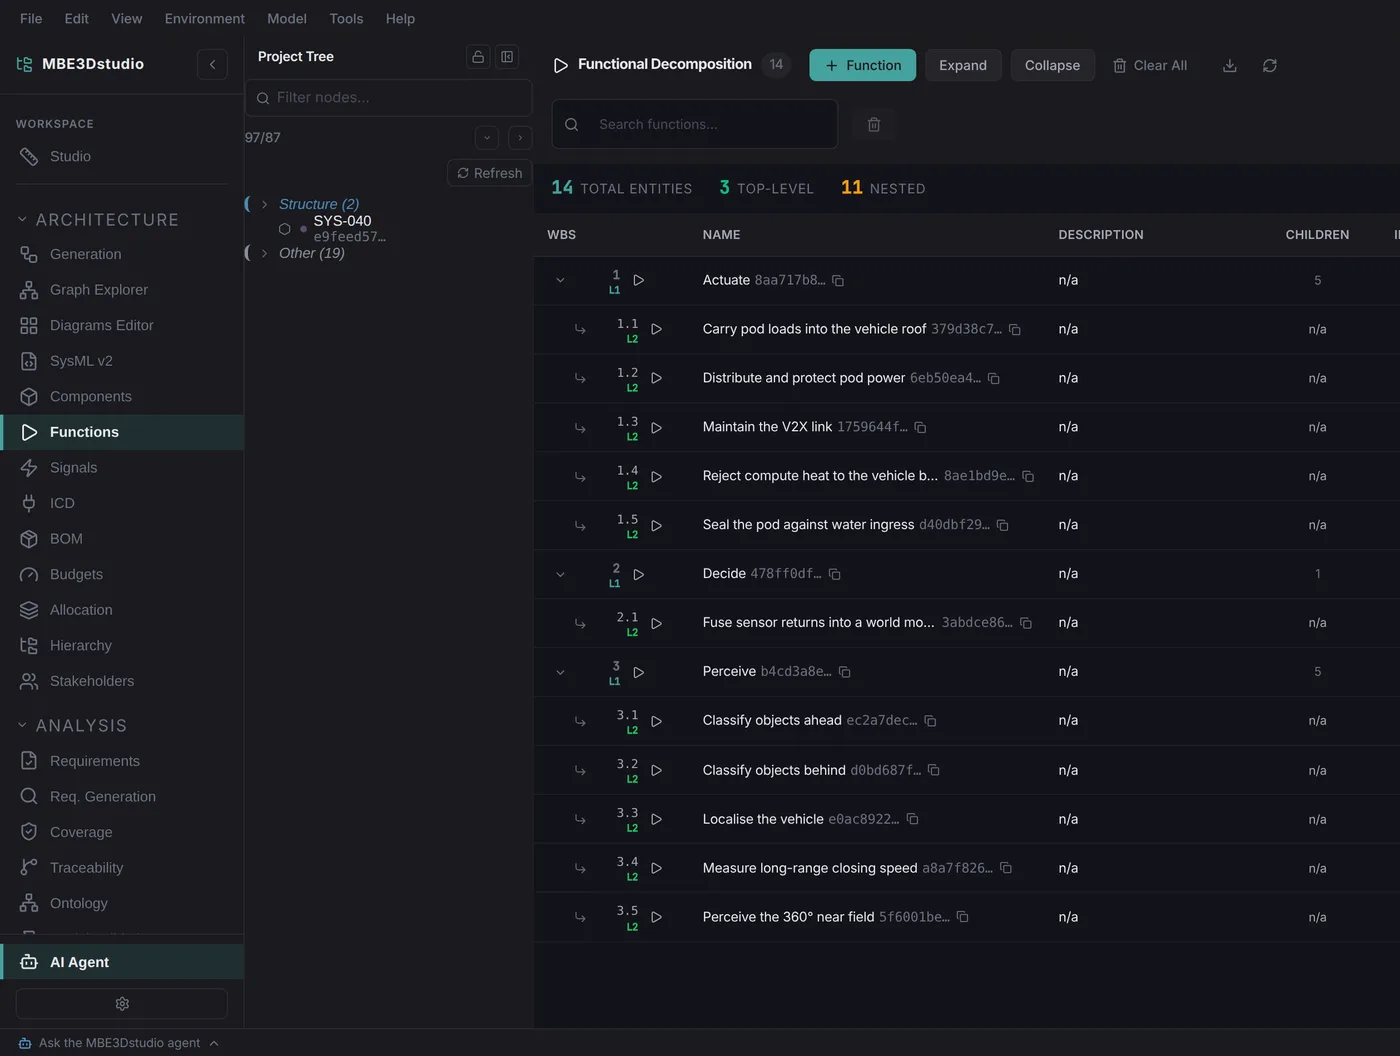
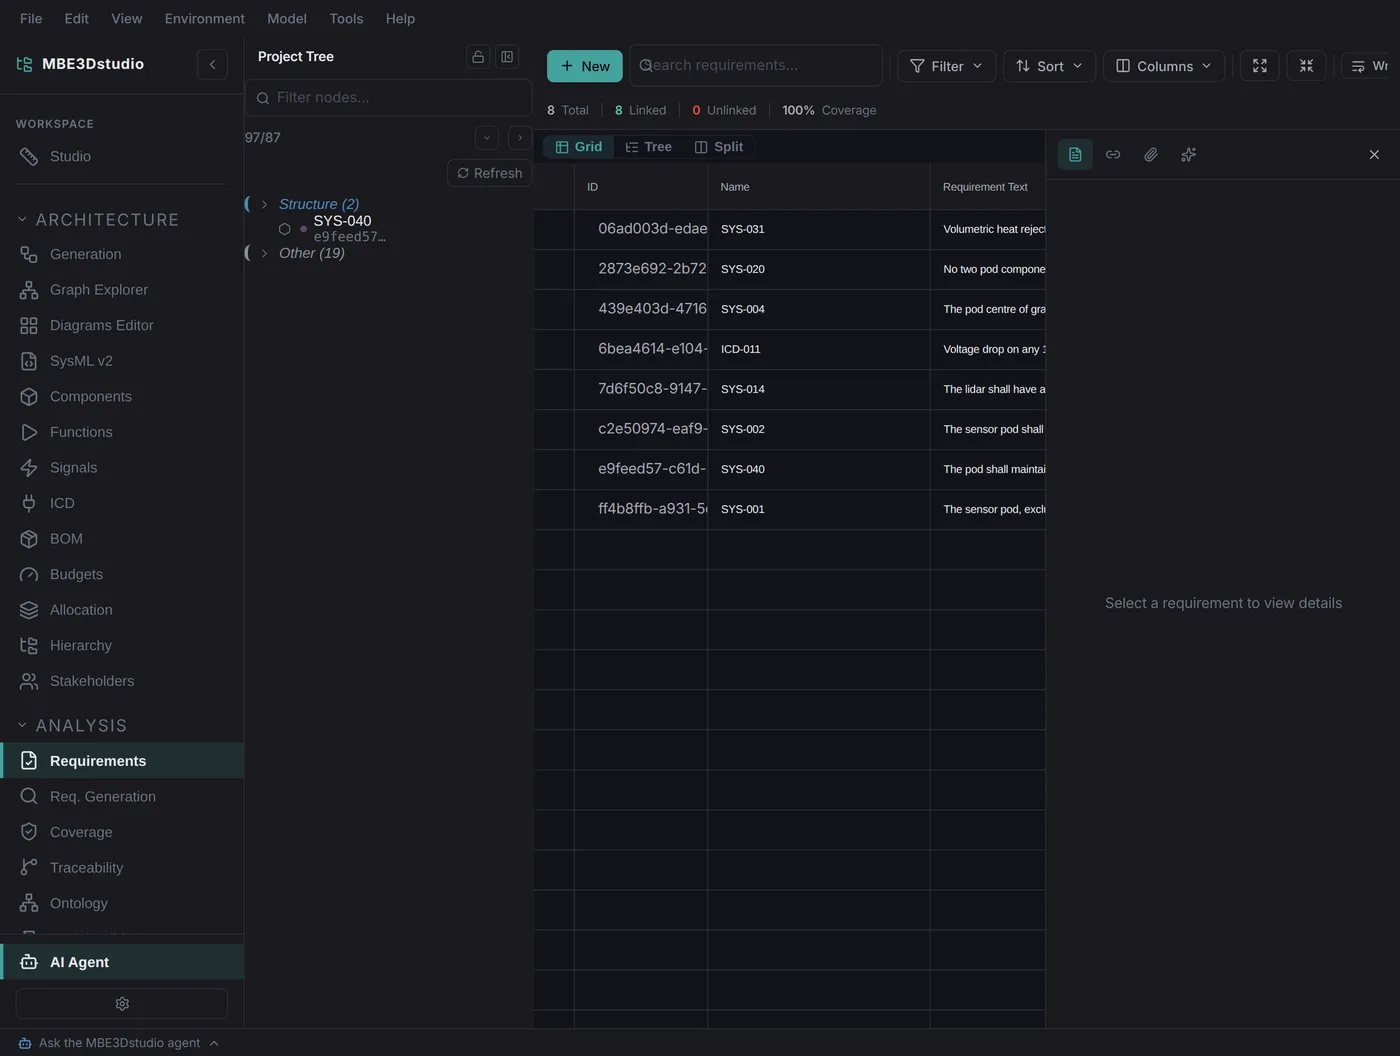
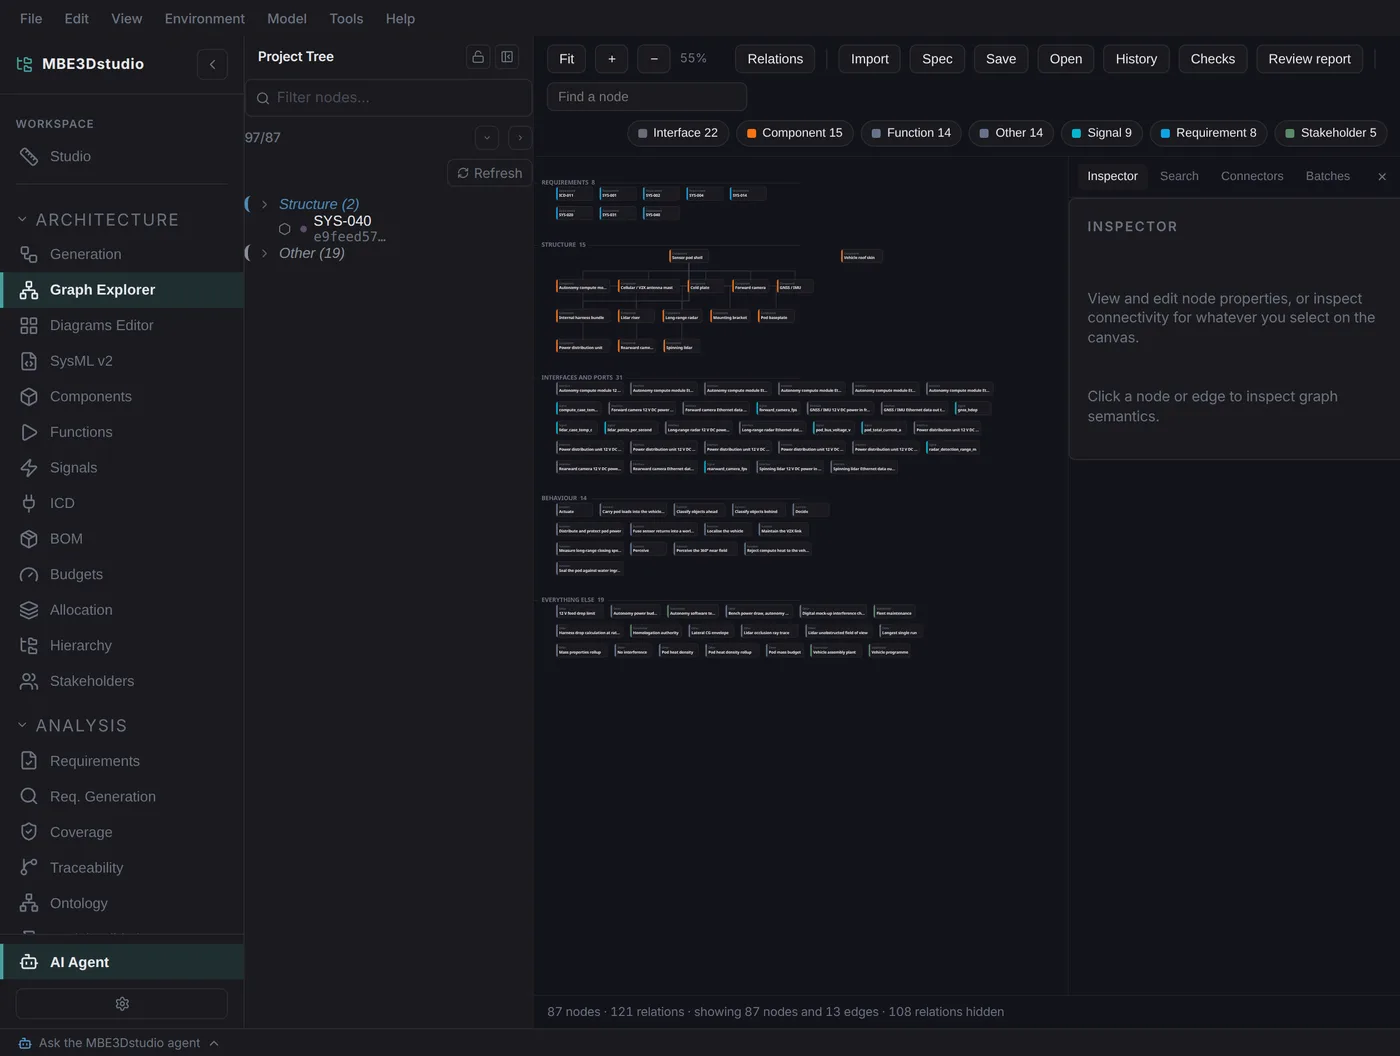
Geometry is where the model is easiest to show, not where most of the work happens. The same model is a functional decomposition, a requirements register, a trace matrix and a graph, and every one of them is read from the same artefact rather than kept beside it.
Things worth trying
Five minutes in the studio
- Click a red finding. It selects the parts it names and frames them in the viewport.
- Drag the antenna mast off the lidar. Watch the coverage climb and the finding disappear as you move.
- Switch mode to standby. The power roll-up drops to a fraction of what it was: the same model, a different question.
- Turn on X-ray and ports. The pod shell goes translucent and every attachment point becomes visible.
- Export the report. You get the Markdown review pack (verdict, constraint table, trace matrix and all) for the state you left the model in.
- Press Ctrl‑Z. Everything you did comes back, including the drags.